Map layer · Weather
Read the day. Before you drive.
Wind, gusts, clouds, rain, thermals, waves and more, drawn on the same map as your spots and parking, hour by hour.
- 6 forecast models
- 13 kinds of weather map
- Wind at 16 heights
On the map
Wind 14 km/h from W
Thursday 13:00
ECMWF IFS · 10 m above ground
On the weather layer
One map. Pick what to read.
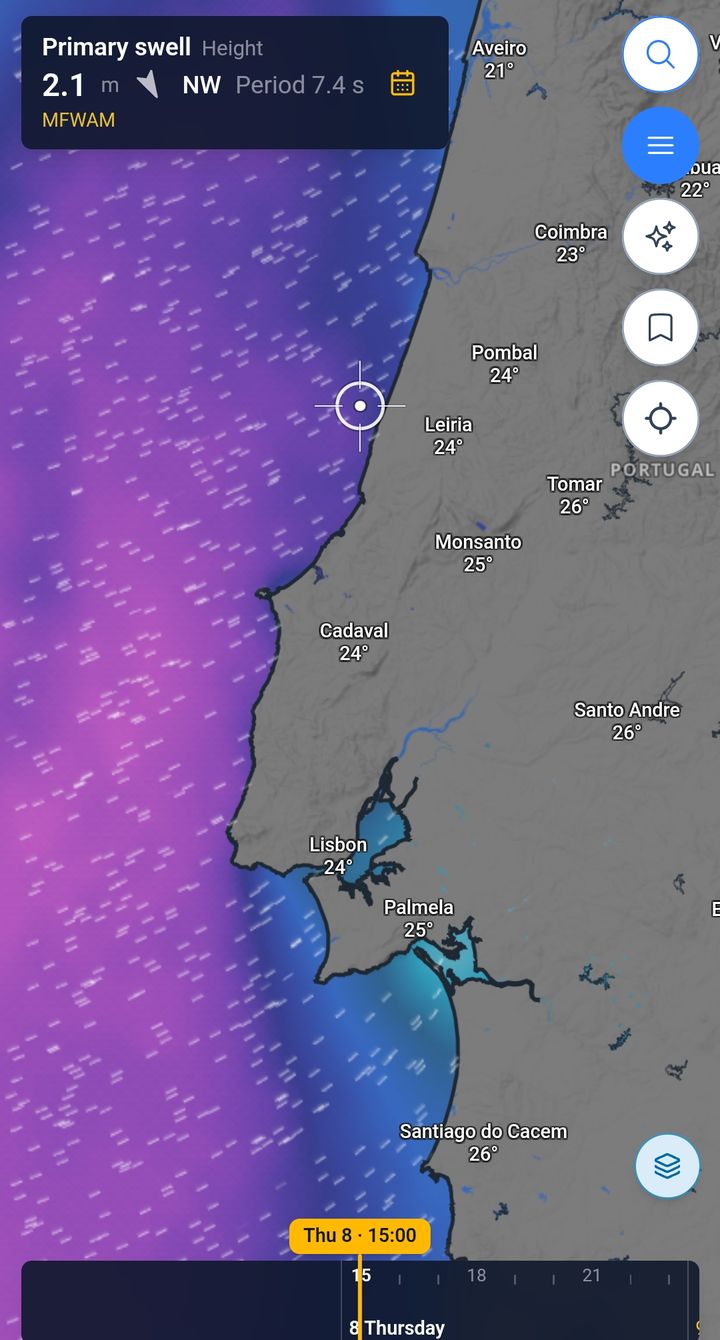
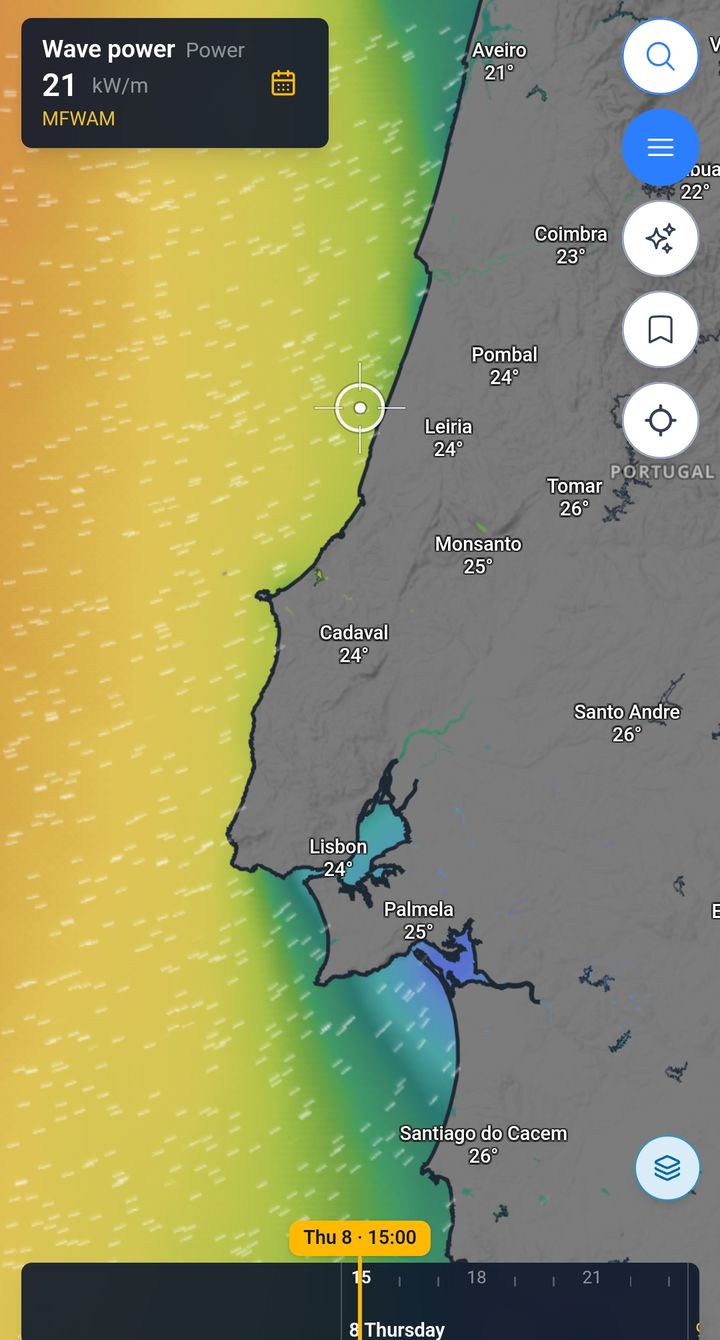
Every layer is drawn straight on the map. Tap the map and the readout gives the number at that point, from the forecast model you choose.
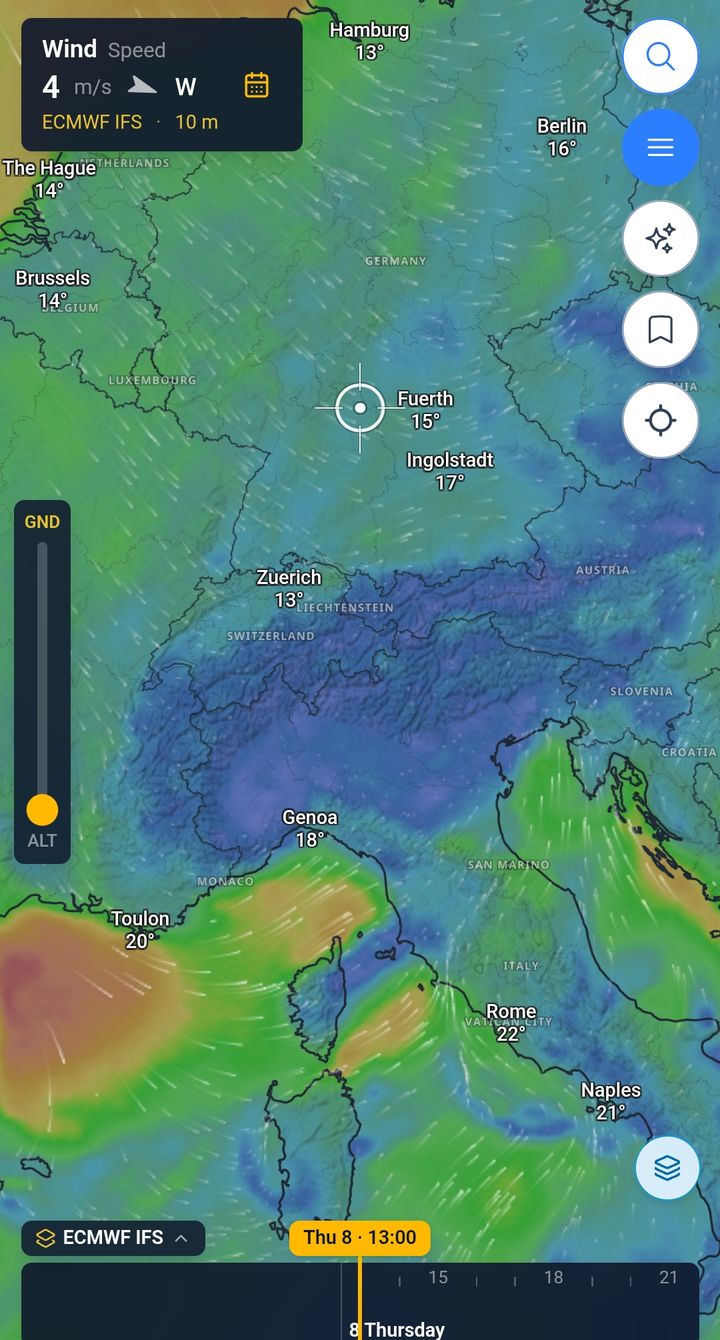
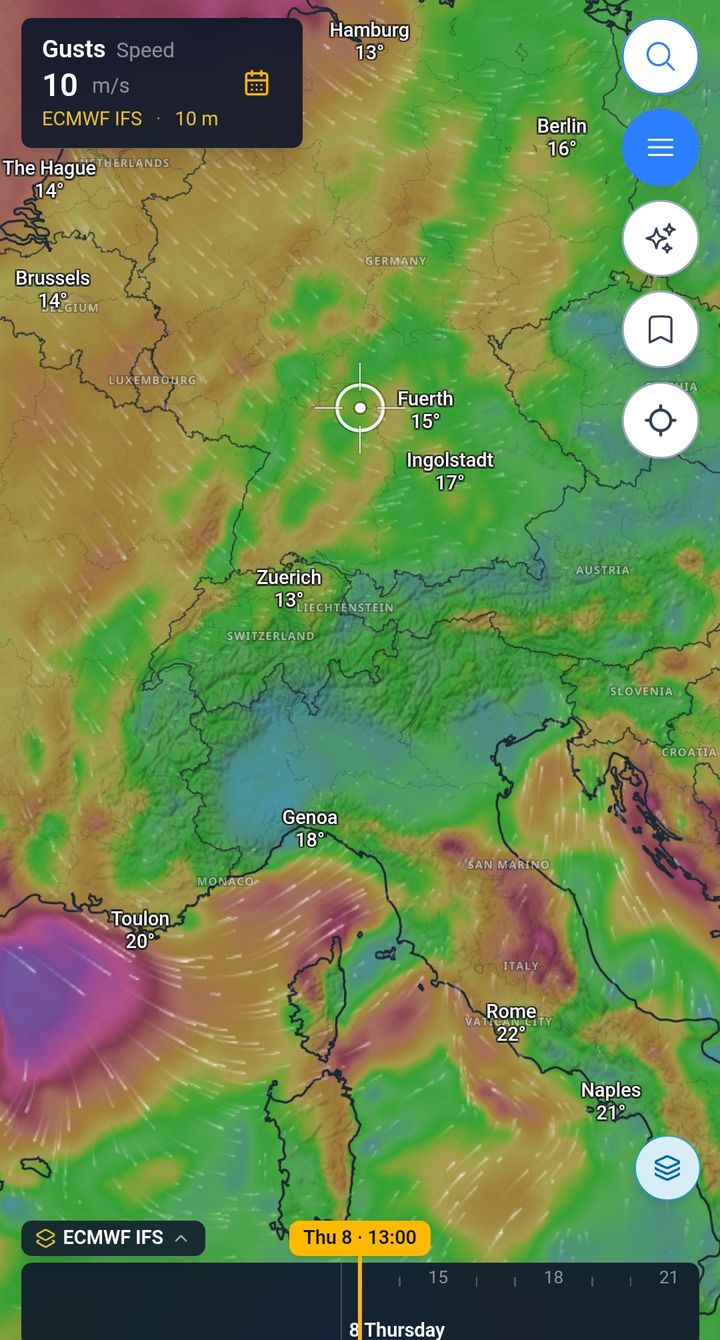
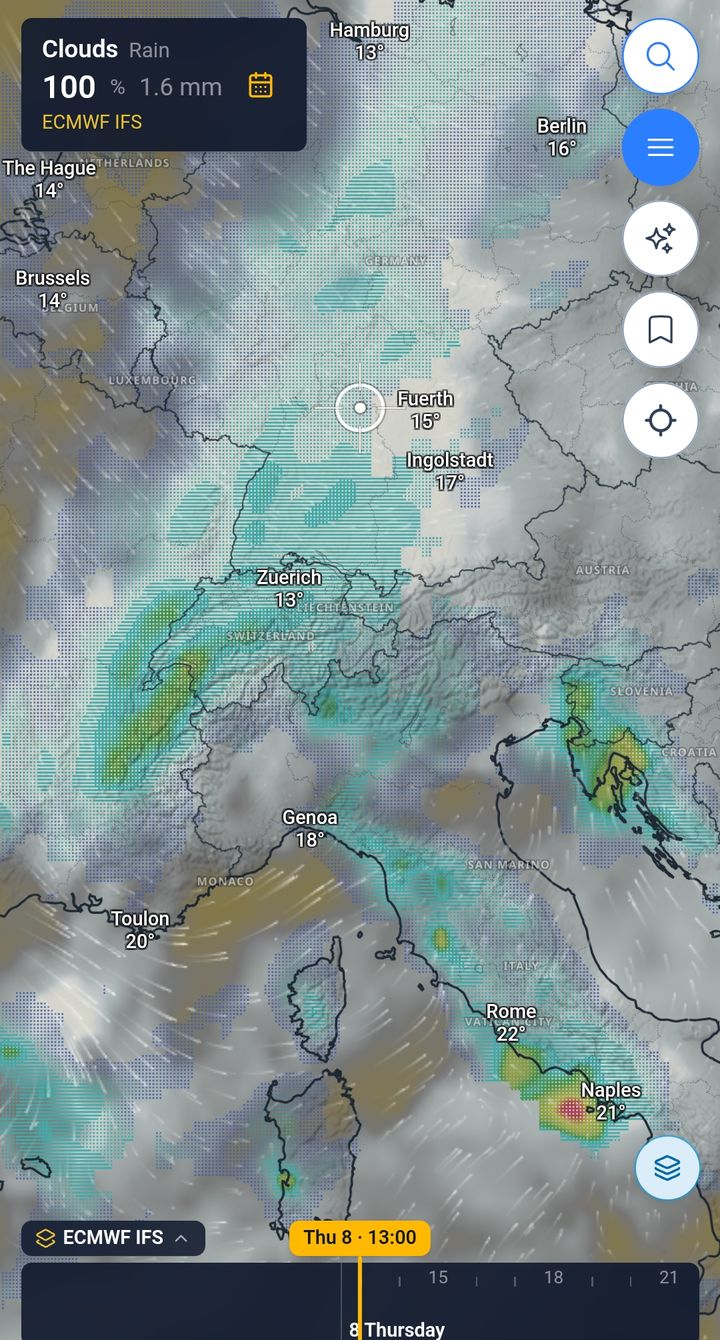
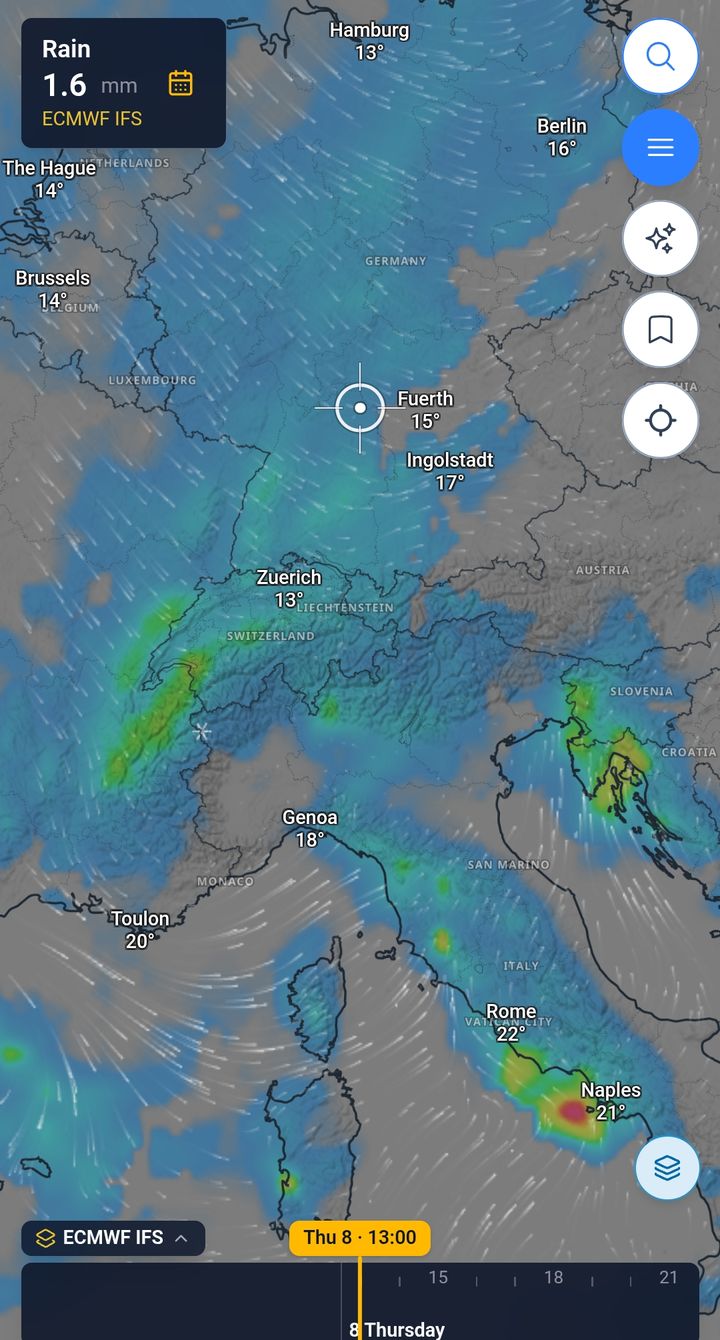
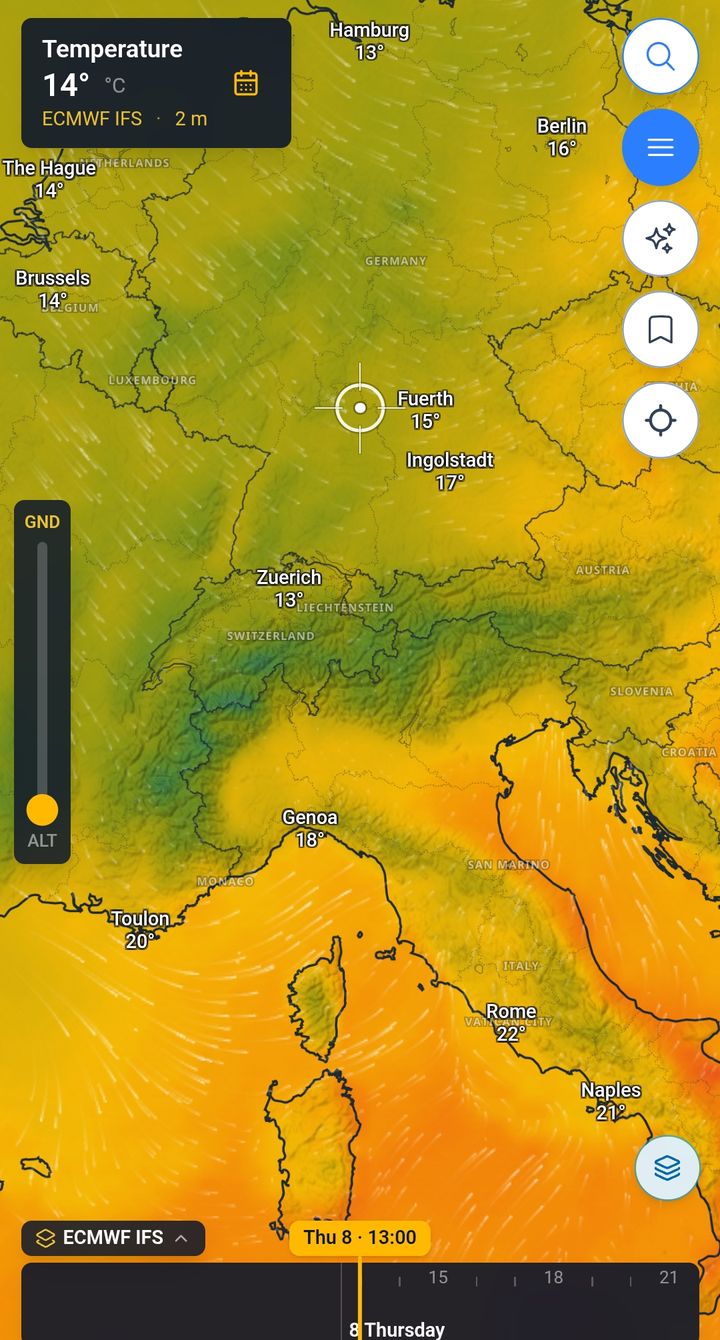
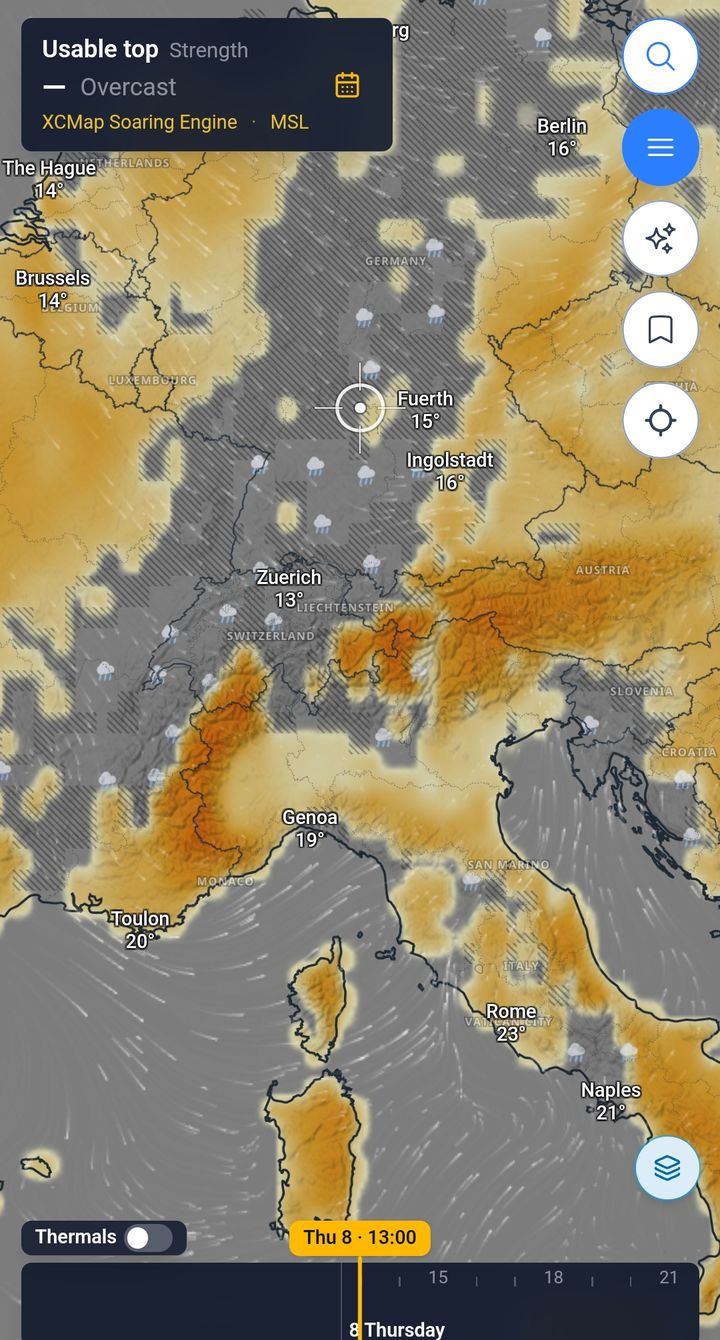
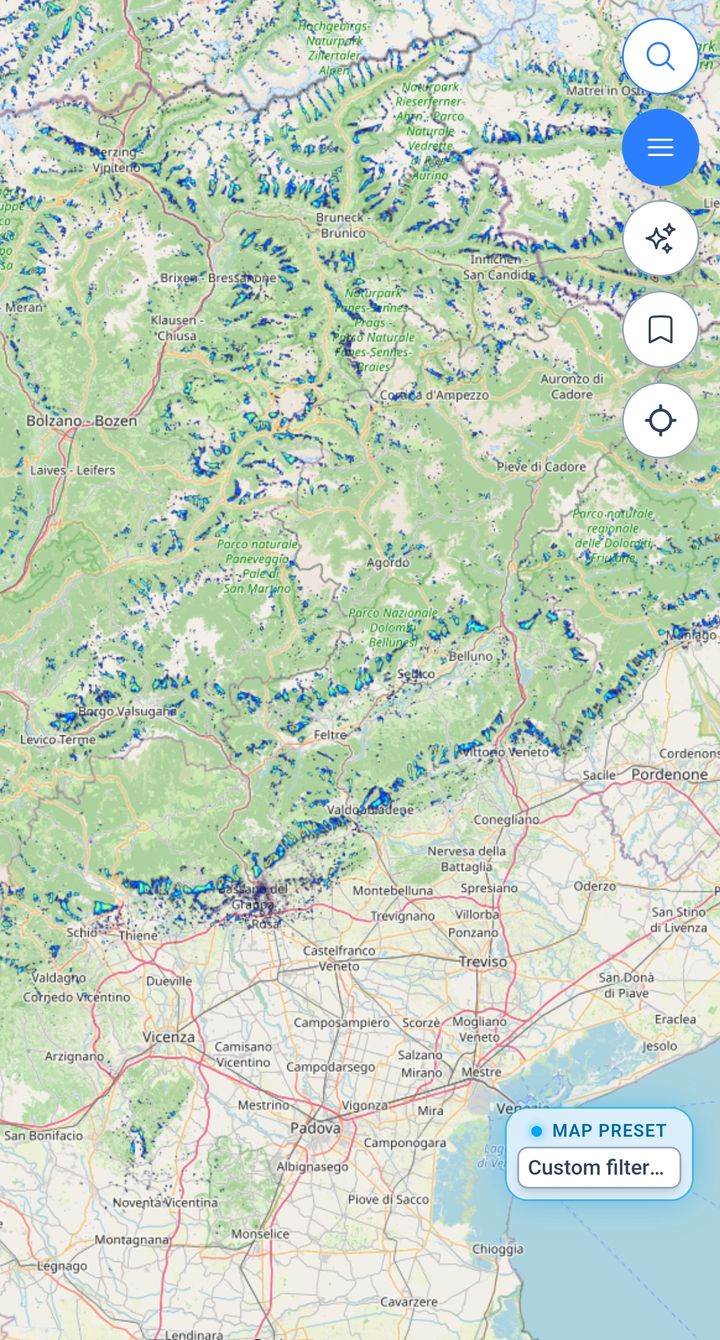
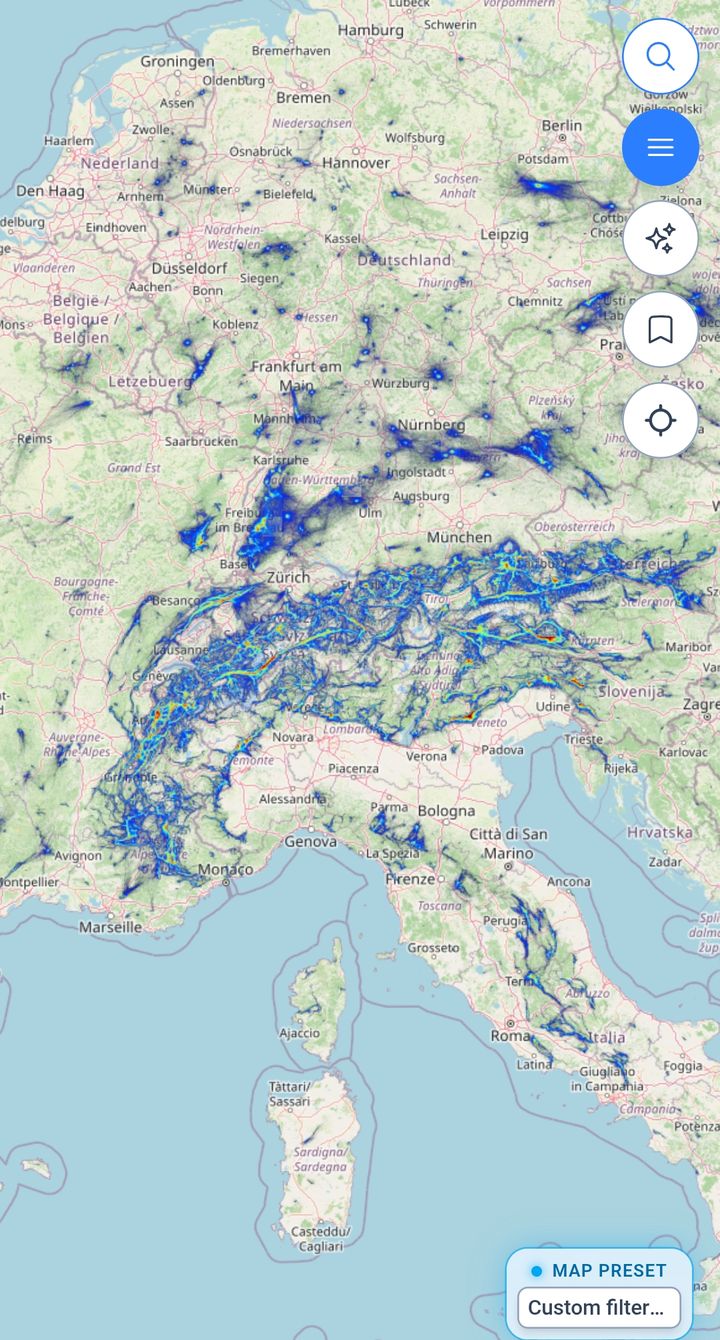
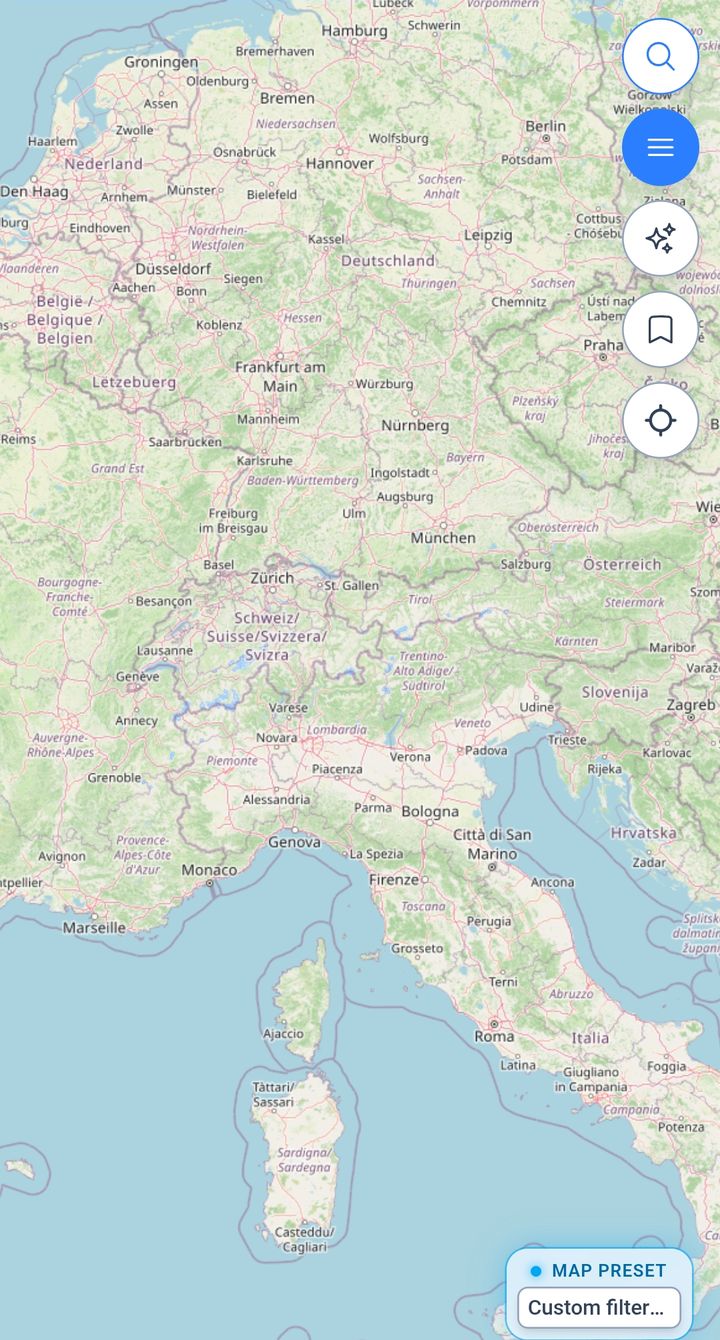
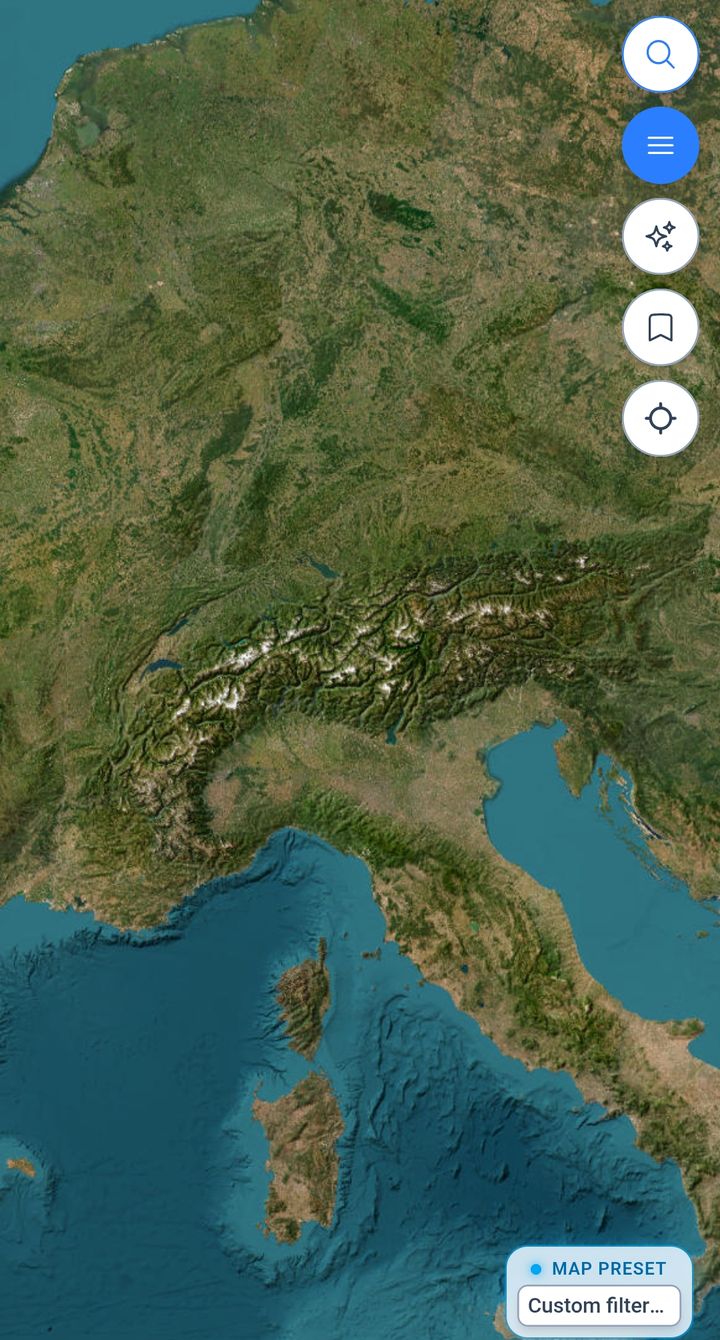
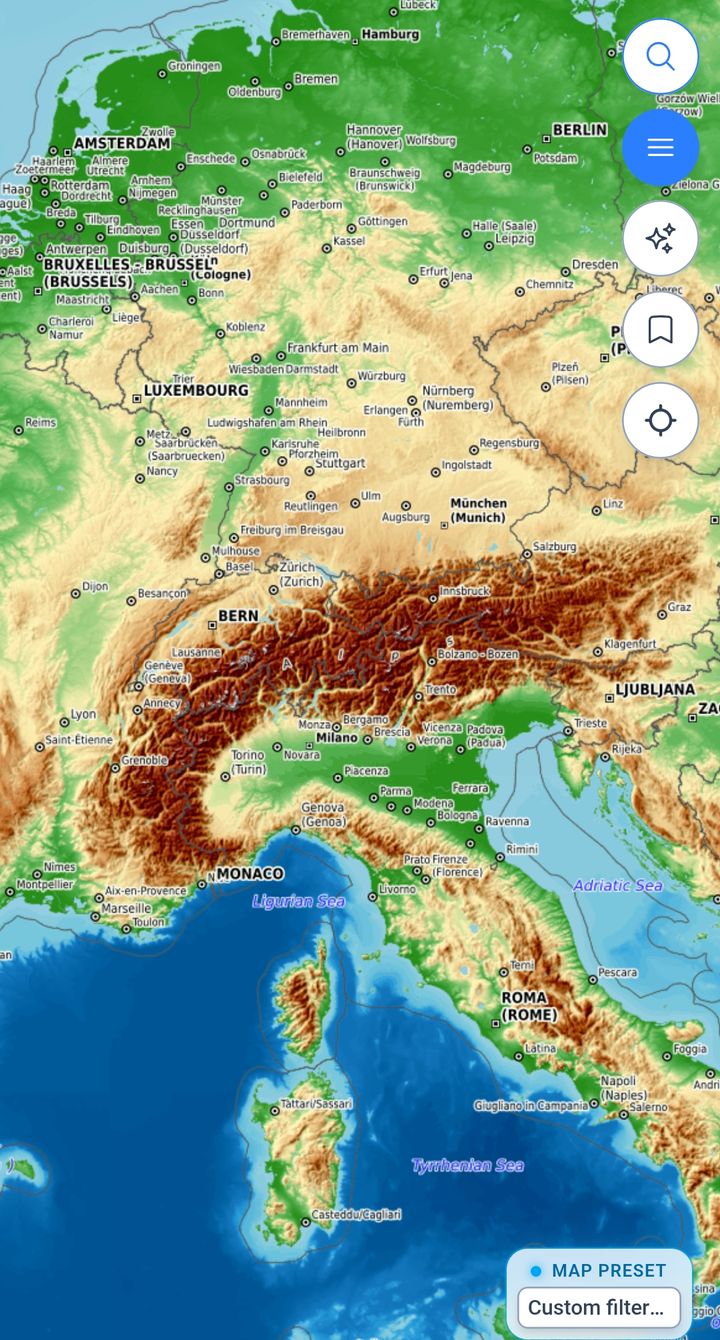
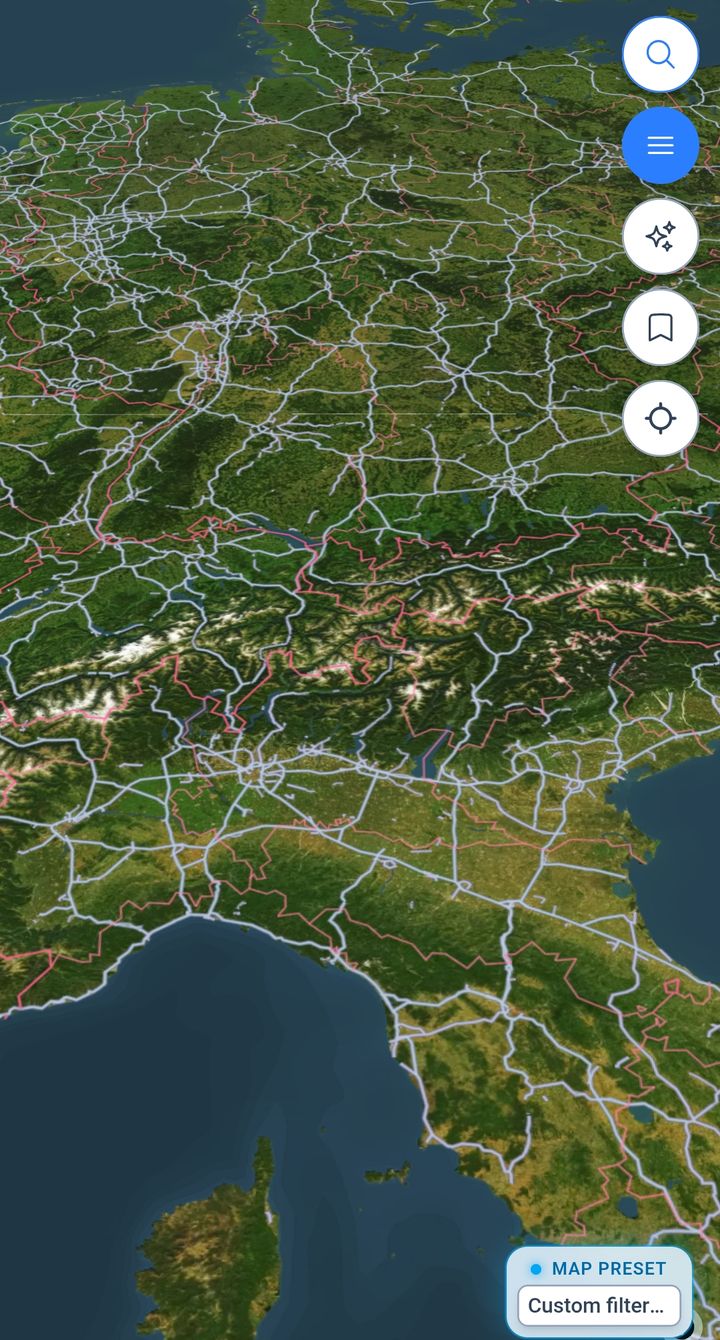
Air
Wind, where you will be.
Sky
Clouds, rain and warmth.
Flying
Lift, for pilots.
Water
Sea state, for the coast.
Map
And the map underneath.
The readout
Numbers, not just colours.
Tap anywhere on the map and a panel gives the value at that point, the forecast model behind it and the hour you are looking at. Scrub the timeline or slide the altitude and it updates.
Readout
Thursday 13:00
Under the crosshair
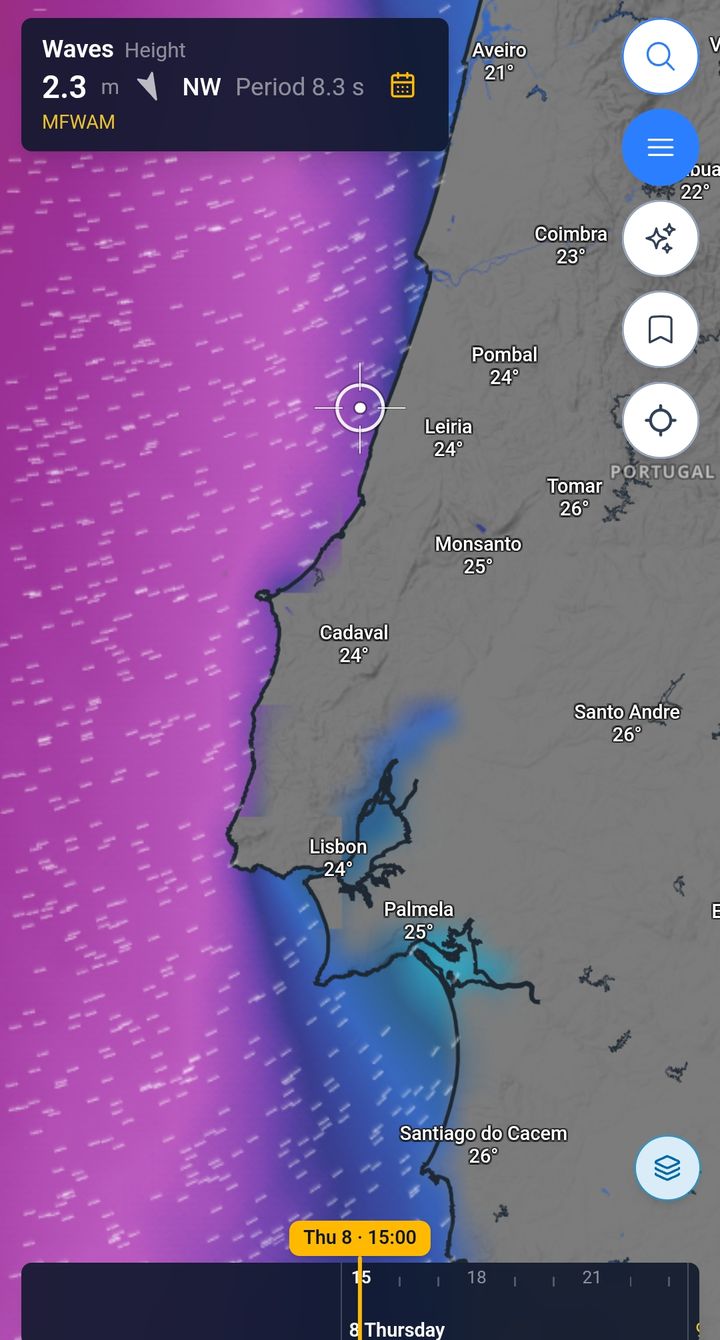
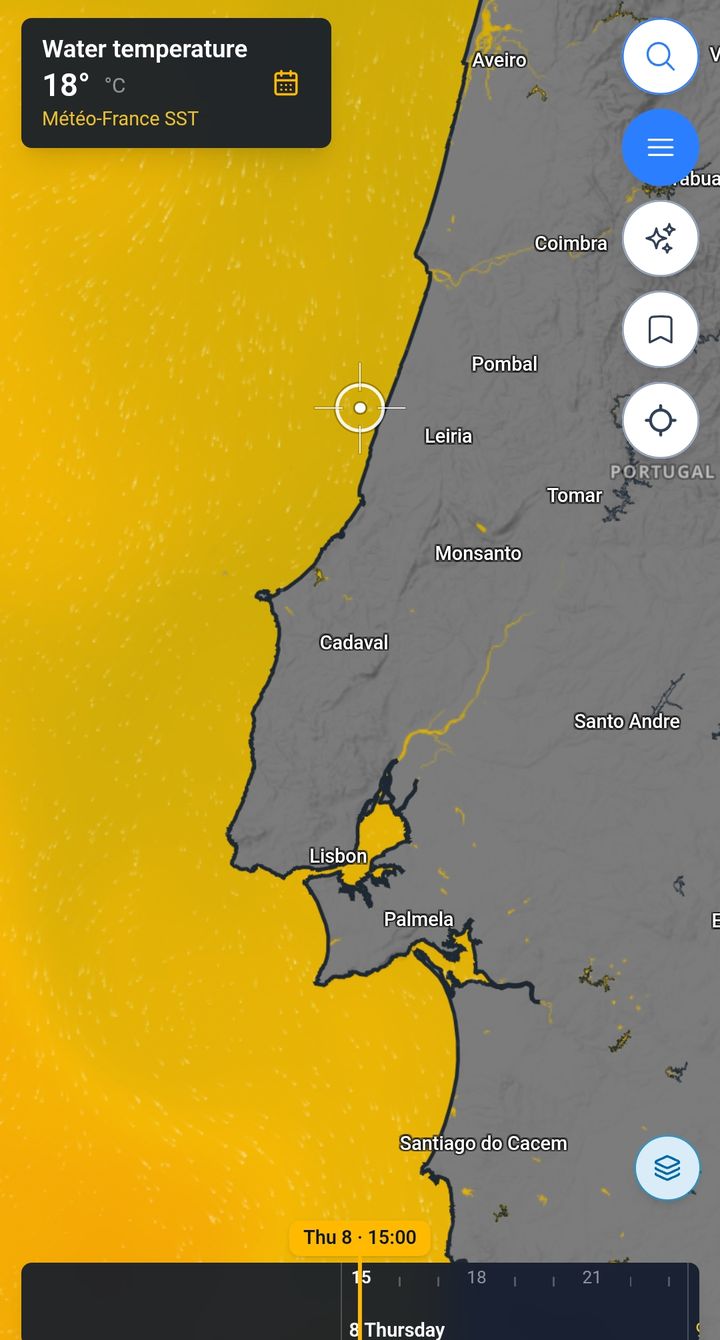
On land: west wind at 14 km/h with gusts to 36, and 14° at ground level. Off the coast: 2.3 m waves from the northwest and 18° water.
Example readings from the app. A forecast is a probability, not a promise.
- 14 km/h Wind From the west, 10 m above ground.
- 36 km/h Gusts Same point, same hour.
- 14° Temperature Air temperature at 2 m.
- 1,362 m Usable top With thermals of 4.1 m/s.
- 2.3 m Waves From the northwest, period 8.3 s.
- 18° Water temperature At the sea surface.
Before you check the sky
Where do the forecasts come from?
Six forecast models feed the layers: ECMWF, GFS, ICON-D2 and ICON-EU for the air, and two Météo-France models for waves and currents. Thermals come from the XCmap Soaring Engine. Each layer names its source on the map.
Is XCmap really free?
Yes. Right now XCmap has only a free version: the map, every sport layer and the forecasts, with no credit card and nothing to pay.
Where in the world does it work?
Anywhere you travel. The map and the weather forecasts are global. Spots such as takeoffs, campings and service points come from open data, partners and travelers, so some regions are mapped in more detail than others, and coverage grows as people contribute.
Where does the data come from?
Base maps come from OpenStreetMap. Spots, amenities and warnings come from open datasets, data partners and the travelers who use XCmap, through their reports and reviews. Weather comes from forecast models.
Your next weather check starts on the map.
Wind, clouds, thermals and waves on the same map as your spots and parking. Free to start.
Try free